
Richmond Metro Area, VA - Community Overview
Life In Richmond, VA

The greater Richmond Metro Area consists of Chesterfield, Hanover and Henrico, has witnessed notable trends and changes in 2023. These trends are vital indicators of the market's health and can influence both buyers and sellers. Let's delve into the key metrics and understand the dynamics shaping the housing market.
Richmond Housing Market Trends
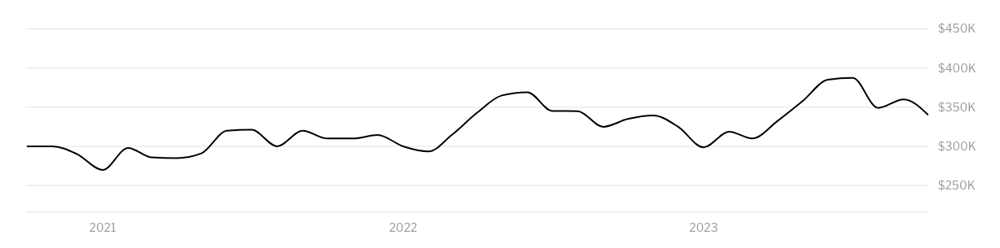
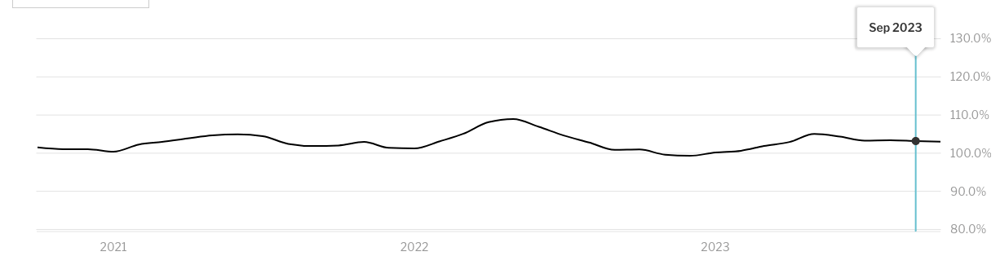
How hot is the Richmond housing market?
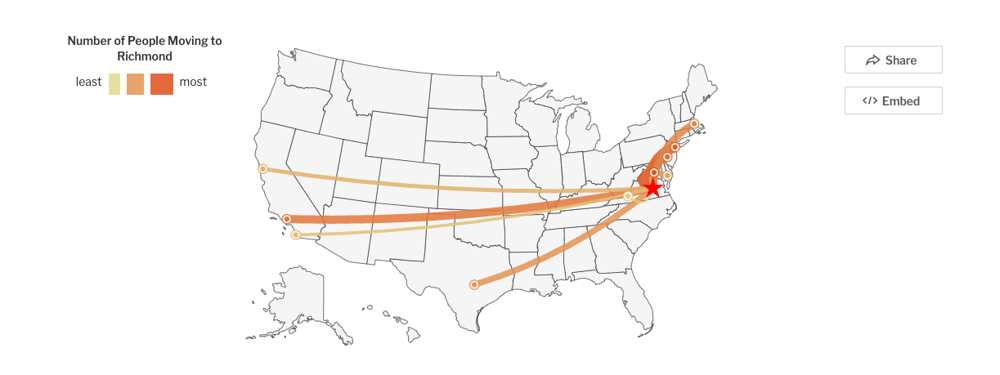
Richmond Migration & Relocation Trends
Single Family Homes – August & Year to Date
New Listings: In 2023, there were 1,059 new listings, marking an 8.3% decrease compared to 2022. This decline suggests a potential shift in supply or demand dynamics within the market.
Pending Sales: The number of pending sales decreased by 18.5%, indicating a potential slowdown in the sales pipeline. Factors such as economic conditions or changes in buyer behavior could be contributing to this trend.
Closed Sales: Closed sales decreased by 27.8%, indicating challenges in finalizing transactions in the current market. This could be due to a variety of factors, including financing issues or a buyer's market.
Days on Market Until Sale: The days on market until sale increased by 15.4%, suggesting properties took longer to sell in 2023 compared to the previous year. This could be influenced by changes in buyer preferences or market saturation.
Median Sales Price: The median sales price showed a 6.9% increase, reaching $405,000 in 2023. This growth indicates an appreciation in property values within the Richmond Metro area.
Average Sales Price: The average sales price increased by 8.5%, reaching $472,515 in 2023. This suggests a general upward trend in property values in the region.
Inventory and Months Supply: The inventory of homes for sale decreased by 10.6%, influencing the months' supply of inventory which increased by 18.2%. This suggests a reduced supply of homes in the market, potentially impacting buyer options.
Condo/Townhomes – August & Year to Date
New Listings: Condo and townhome listings increased by 11.8% in 2023, compared to the previous year. This suggests a growing interest in these property types.
Pending Sales: Pending sales increased by 10.3%, indicating a healthy demand for condo and townhome properties in the Richmond Metro area.
Closed Sales: Closed sales saw a 1.8% increase, showcasing steady transactions in the condo and townhome market.
Days on Market Until Sale: The days on market until sale increased by 13.0%, indicating a slightly longer selling period compared to the previous year.
Median Sales Price: The median sales price for condo/townhomes showed a 14.0% increase, suggesting growing property values in this segment.
Average Sales Price: The average sales price increased by 13.8%, reflecting the upward trend in condo and townhome property values.
Inventory and Months Supply: The inventory of condo and townhome properties for sale increased by 16.7%, affecting the months' supply of inventory which increased by 25.0%.
1,021 Properties available in Richmond!
$499,999
3 Beds | 2 Baths \ 1,802 SqFt
Single Family Home
$217,500
2 Beds | 1 Baths | 720 SqFt
Single Family Home
$250,000
3 Beds | 1 Baths | 1,376 SqFt
Single Family Home
$499,999
3 Beds | 2 Baths \ 1,802 SqFt
Single Family Home
$217,500
2 Beds | 1 Baths | 720 SqFt
Single Family Home
$250,000
3 Beds | 1 Baths | 1,376 SqFt
Single Family Home
$499,999
3 Beds | 2 Baths \ 1,802 SqFt
Single Family Home
$217,500
2 Beds | 1 Baths | 720 SqFt
Single Family Home
$250,000
3 Beds | 1 Baths | 1,376 SqFt
Single Family Home
$499,999
3 Beds | 2 Baths \ 1,802 SqFt
Single Family Home
$217,500
2 Beds | 1 Baths | 720 SqFt
Single Family Home
$250,000
3 Beds | 1 Baths | 1,376 SqFt
Single Family Home
$499,999
3 Beds | 2 Baths \ 1,802 SqFt
Single Family Home
$217,500
2 Beds | 1 Baths | 720 SqFt
Single Family Home
$250,000
3 Beds | 1 Baths | 1,376 SqFt
Single Family Home
$499,999
3 Beds | 2 Baths \ 1,802 SqFt
Single Family Home
$217,500
2 Beds | 1 Baths | 720 SqFt
Single Family Home
$250,000
3 Beds | 1 Baths | 1,376 SqFt
Single Family Home